IMAGE 01 · 2006 × 2378 px · Cached rendition
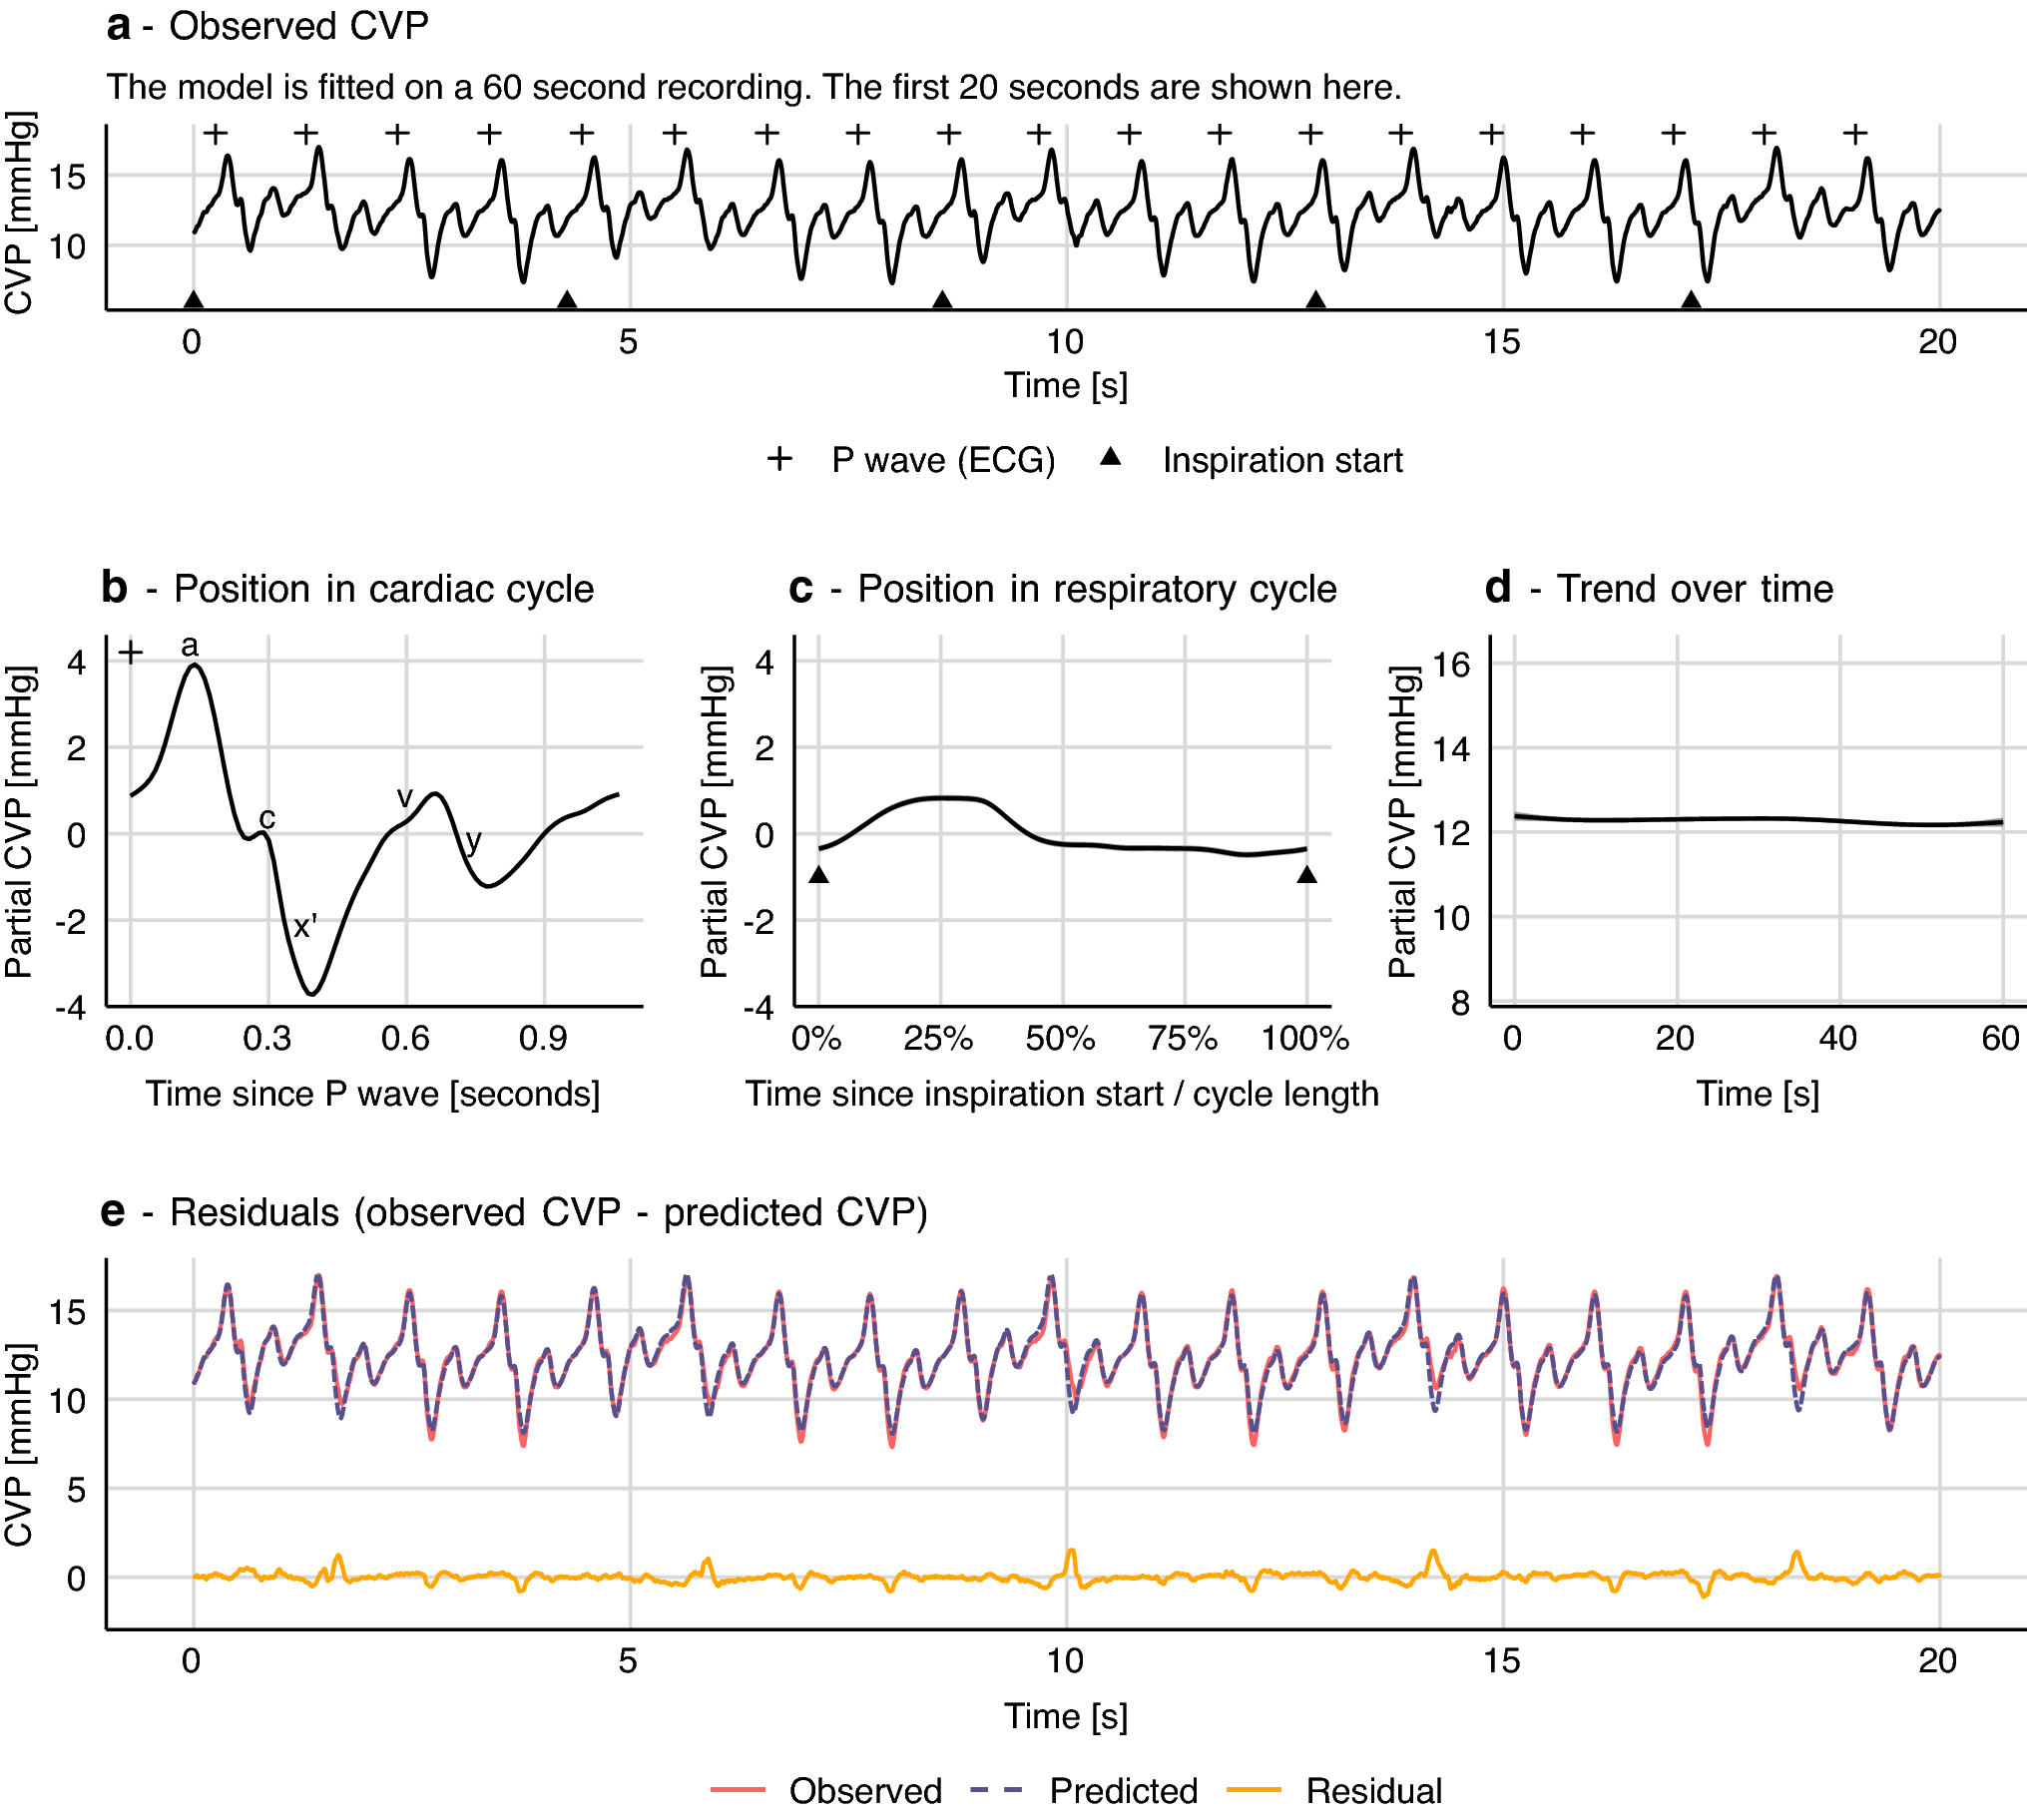
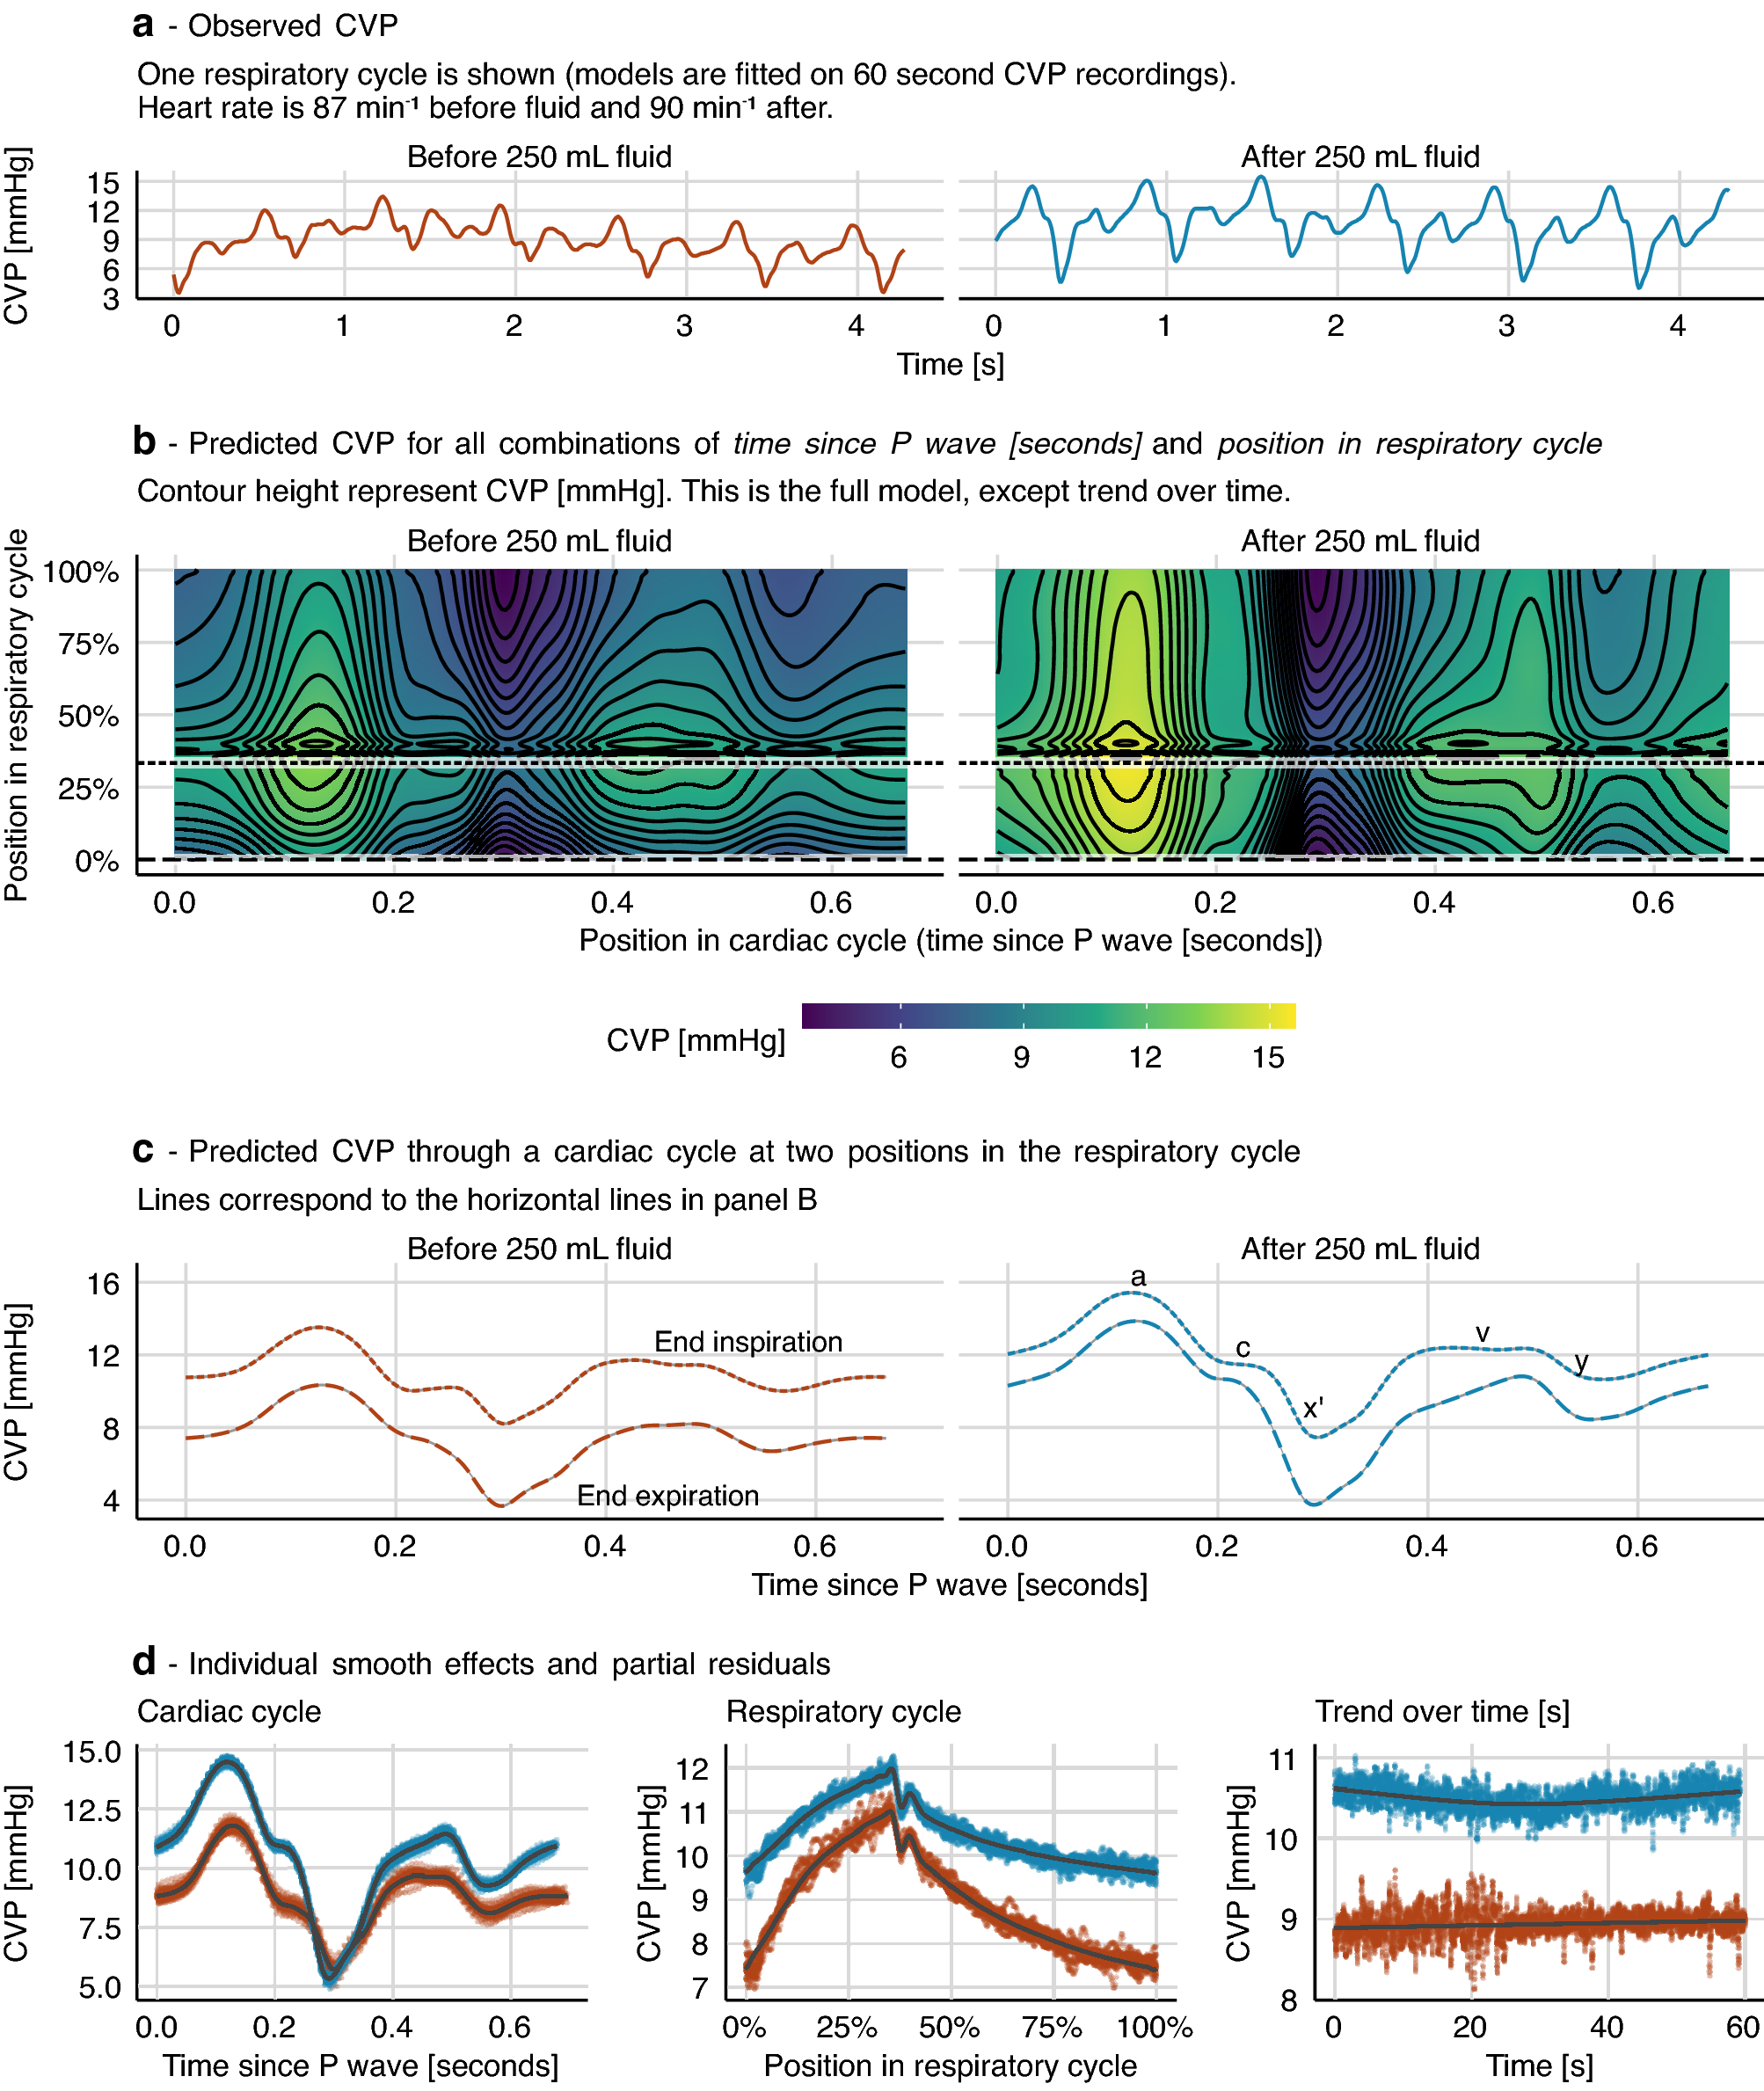
Central venous pressure waveform
Figure 6a shows actual CVP recordings before and after infusion; the remaining panels are modeled/derived. Each model was fitted to a separate one-minute 125 Hz CVP recording. Distinct source data from Figure 4.
Credit & reuse
Johannes Enevoldsen, Gavin L. Simpson, and Simon T. Vistisen · CC BY 4.0 · inherited_catalog_not_refetched
License record ↗ · Media ID MED-7ee55d0d4762ec61ce4a